Summary of Projects
Chapter 1
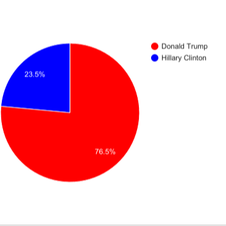
For the chapter 1 project my partners Gunner, Mitchell, and I conducted a survey. This survey asked the population (our statistics class) whether they preferred Hillary Clinton or Donald Trump for president. In this project we explained all of the steps of how to make a survey as well as the downfalls our survey may have had.
For the chapter 1 project my partners Gunner, Mitchell, and I conducted a survey. This survey asked the population (our statistics class) whether they preferred Hillary Clinton or Donald Trump for president. In this project we explained all of the steps of how to make a survey as well as the downfalls our survey may have had.
Chapter 2
For the chapter 2 project my partner Katie and I created 7 different types of graphs based on a frequency table we made. This frequency table was based on the average score of every pro basketball team over the last two years. Some of the graphs we created were a stem and leaf plot, a histogram, a relative frequency table, a cumulative frequency table, a pareto chart, a circle graph, and a time series graph.
For the chapter 2 project my partner Katie and I created 7 different types of graphs based on a frequency table we made. This frequency table was based on the average score of every pro basketball team over the last two years. Some of the graphs we created were a stem and leaf plot, a histogram, a relative frequency table, a cumulative frequency table, a pareto chart, a circle graph, and a time series graph.

Chapter 3
For the chapter 3 project my partner Ashlynn and I created a box and whisker plot. We used the points scored each game by Draymond Green over the 2010-2011 and 2011-2012 seasons to create this graph. We found 5% and 10% trimmed means and calculated a 75%, 88.9%, and 93.8% Chebyshev’s Theorem.
For the chapter 3 project my partner Ashlynn and I created a box and whisker plot. We used the points scored each game by Draymond Green over the 2010-2011 and 2011-2012 seasons to create this graph. We found 5% and 10% trimmed means and calculated a 75%, 88.9%, and 93.8% Chebyshev’s Theorem.

Chapter 4
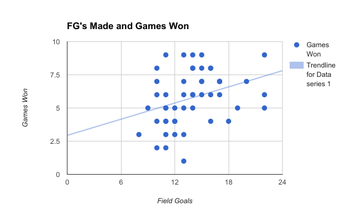
For the chapter 4 project my partner Cody and I created a scatter plot with a line of best fit. This scatter plot was created by comparing the amount of field goals a team had made and comparing it with how many games the team won. We found the kickers by finding the top 50 kickers and then checking their records.
For the chapter 4 project my partner Cody and I created a scatter plot with a line of best fit. This scatter plot was created by comparing the amount of field goals a team had made and comparing it with how many games the team won. We found the kickers by finding the top 50 kickers and then checking their records.
Chapter 5
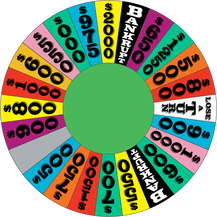
For the chapter 5 project my partner Delanie and I looked at several probability scenarios dealing with the wheal of fortune. We also looked at permutations, combinations, and the multiplication rule of counting.
For the chapter 5 project my partner Delanie and I looked at several probability scenarios dealing with the wheal of fortune. We also looked at permutations, combinations, and the multiplication rule of counting.
Chapter 6
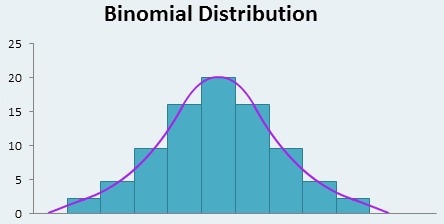
For the chapter 6 project my partner Travis and I explained binomial probability distributions and related topics. To do this we used examples of times when these terms could actually be seen in real life scenarios.
For the chapter 6 project my partner Travis and I explained binomial probability distributions and related topics. To do this we used examples of times when these terms could actually be seen in real life scenarios.
Chapter 7
For the chapter 7 project my partner Maddie and I sampled the Juniors and Seniors of our high school, to find how many much time they spent on electronics each day. We received 61 replies out of the 75 students we surveyed. With this information we created a histogram, a 5 number summary, and calculated our z-scores.
For the chapter 7 project my partner Maddie and I sampled the Juniors and Seniors of our high school, to find how many much time they spent on electronics each day. We received 61 replies out of the 75 students we surveyed. With this information we created a histogram, a 5 number summary, and calculated our z-scores.

Chapter 8
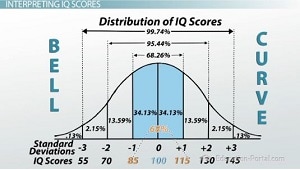
For the chapter 8 project my partners Dallas, Hanna, and I had to calculate critical values, margin of errors, and confidence intervals. To do this we were given a sample of 60 adult IQ scores.
For the chapter 8 project my partners Dallas, Hanna, and I had to calculate critical values, margin of errors, and confidence intervals. To do this we were given a sample of 60 adult IQ scores.
Chapter 9
For the chapter 9 project my partner Lauren and I tested the claim that people spend 20 minutes on Facebook each day. To do this we randomly sampled 30 students from out school. We then came up with our null and alternate hypothesis. We then calculated a t-score and used that to estimate our p-value. We then compared our p-value to our level of significance to decide to reject or fail to reject the null hypothesis.
For the chapter 9 project my partner Lauren and I tested the claim that people spend 20 minutes on Facebook each day. To do this we randomly sampled 30 students from out school. We then came up with our null and alternate hypothesis. We then calculated a t-score and used that to estimate our p-value. We then compared our p-value to our level of significance to decide to reject or fail to reject the null hypothesis.
Chapter 10
For the chapter 10 project my partners Austin, Erin, and I had to solve problem 10 on page 486 of our textbook. This problem was to test the null hypothesis that there was no difference in voter turnout between California and Colorado. In order to test this we had to calculate a lot of p-values q-values and much more.
For the chapter 10 project my partners Austin, Erin, and I had to solve problem 10 on page 486 of our textbook. This problem was to test the null hypothesis that there was no difference in voter turnout between California and Colorado. In order to test this we had to calculate a lot of p-values q-values and much more.